
Enable ASP.NET Web API Tracing in FREB in Azure App Service
One of the most powerful (yet least used) diagnostic features of Azure App Service is the Failed Request Tracing feature. All apps hosted on App Services using the Windows stack can benefit from this feature. Failed Request Tracing is a powerful feature of IIS and Azure App Service gets it for free. This feature gives you a breakdown of every notification that got fired for all the handlers and modules that participated in the request processing pipeline of IIS. It helps in identifying where the app is spending time and how much (down to the accuracy of milliseconds).
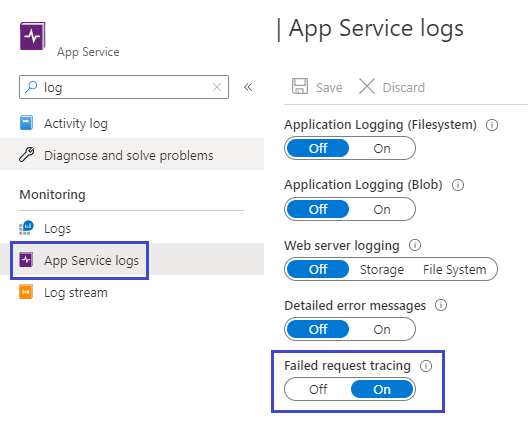
To enable Failed Request Tracing for your app, you have to enable it by going to App Service Logs for your app in Azure Portal and enable Failed Request Tracing to On as shown below.
By default, Failed Request Tracing will capture logs when a request fails with an error HTTP Status code (i.e. HTTP status codes between 400 to 600) but you can easily change the default configuration to generate a trace file whenever a request takes more than X seconds to load (sample below). Getting FREB traces for a slow request help in identifying where exactly the request is spending time and helps you fine-tune the configuration or application code to improve the performance.
FREB for ASP.NET Web API applications (ASP.NET Classic Framework)
While FREB tracing is awesome, it doesn’t help much especially if the delay is within the application code. In those situations, most of the time the culprit module is identified as ManagedPipelineHandler or System.Web.Http.WebHost.HttpControllerHandler handler which is the default handler for ASP.NET Web API requests. However, with a few steps, you should be able to leverage FREB tracing to help you debug application code in Web API as well. This does require you to change some application code so that your app can start emitting the write ETW events.
Change ASP.NET WebAPI Application code to emit ETW Events
-
Install the Nuget Packages for WebApi Tracing. In the Package Manager Console for your project, type the following commands.
Install-Package Microsoft.AspNet.WebApi.Tracing Update-Package Microsoft.AspNet.WebApi.WebHost -
Enable tracing in WebApiConfig. Open the file
WebApiConfig.csin theApp_Startfolder. Add the following code to theRegistermethod.public static class WebApiConfig { public static void Register(HttpConfiguration config) { // New code config.EnableSystemDiagnosticsTracing(); // Other configuration code not shown. } }
IMPORTANT NOTE: If the Web API is Owin based, then you should call
config.EnableSystemDiagnosticsTracing()method insideStartup.cs
Ok, with that done, now your app is emitting the right ETW events and now we need to plug them into the FREB’s tracing infrastructure. To do that, some configuration changes need to be done to the application’s web.config file.
Hook up the ETW events generated by your app in FREB’s ETW session
-
Under
<system.web>section , add the<trace>element in this way<trace enabled="true" pageOutput="false" requestLimit="10000" writeToDiagnosticsTrace="true" /> -
Modify the
<system.diagnostics>section and add the following configuration so that default ETW events emitted by your app get hooked up in the IIS ETW trace listener.<system.diagnostics> <trace autoflush="true" > <listeners> <add name="System.Net.IISETW" type="System.Web.IisTraceListener,System.Web,version=4.0.0.0,Culture=neutral,PublicKeyToken=b03f5f7f11d50a3a" /> </listeners> </trace> </system.diagnostics> -
Change the default FREB configuration to collect traces whenever request takes more than X amount of seconds. This section needs to go in
<system.webServer>section of theweb.configfile. In the below example, I am setting the timeTaken to 15 seconds but you can modify it as per your need.<tracing> <traceFailedRequests> <remove path="*" /> <add path="*"> <traceAreas> <add provider="ASP" verbosity="Verbose" /> <add provider="ASPNET" areas="Infrastructure,Module,Page,AppServices" verbosity="Verbose" /> <add provider="ISAPI Extension" verbosity="Verbose" /> <add provider="WWW Server" areas="Authentication,Security,Filter,StaticFile,CGI,Compression,Cache,RequestNotifications,Module,FastCGI,WebSocket" verbosity="Verbose" /> </traceAreas> <failureDefinitions timeTaken="00:00:15" /> </add> </traceFailedRequests> </tracing>
And you are all set!
Viewing Failed Request Tracing files
Now, whenever your app experiences slowness, you will get a FREB file generated in d:\home\LogFiles\W3SVC* folder and you can leverage the Failed Request Tracing Logs tool to view those logs. To view the generated files,
- Go to Diagnose and Solve blade for your app in Azure Portal.
- Choose Diagnostic Tools.
- Choose Failed Request Tracing Logs under Support Tools
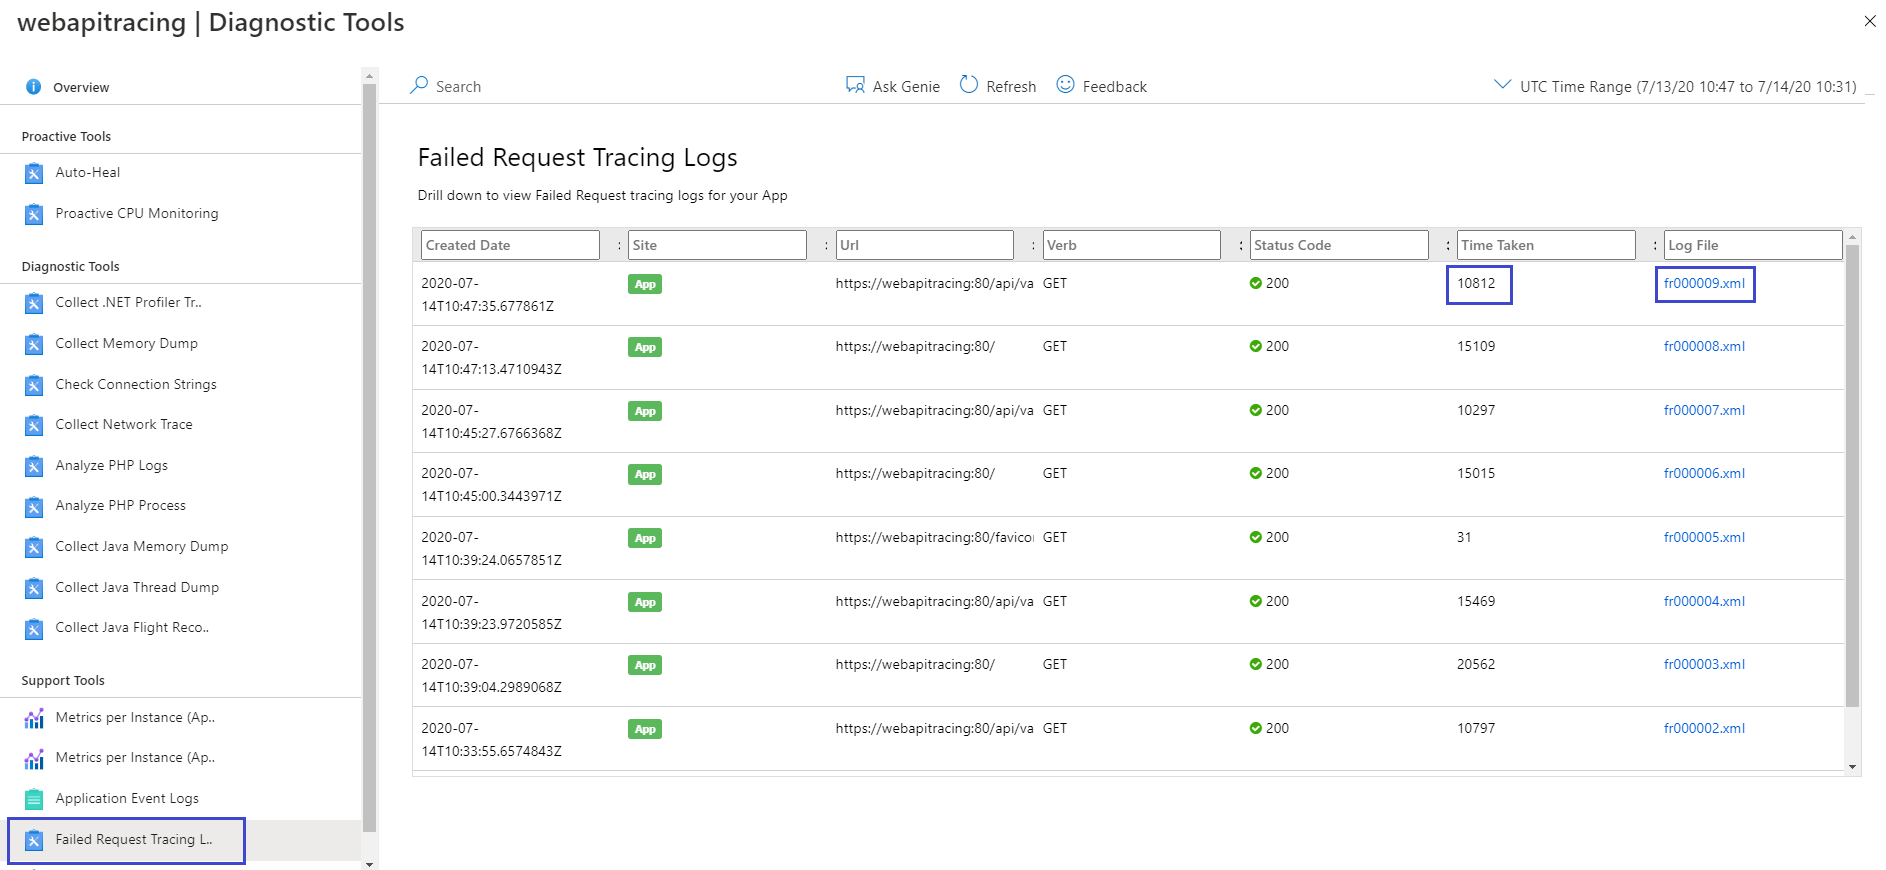
- Filter or sort the view displayed by the column name.
- Since we are interested in Slow Requests, you can click on the Time Taken field to sort by the time taken in descending order. This allows you to get to the file of interest quickly.
- Click on the file name to open the file in a new browser.
-
Notice that along with the Platform related events, you also have events emitted by the ASP.NET WEB API infrastructure and these allow you to identify where exactly within the WEB API infrastructure the request is spending most of its time. In my case, this is what I see.

So in the above example, we can see a delay of 15 seconds between ApiControllerActionInvoker.InvokeActionAsync and MyBadFilterAttribute.ExecuteActionFilterAsync proving that delay is introduced by MyBadFilter MVC filter and this is the exact code for MyBadFilter action attribute
public class MyBadFilterAttribute : Attribute, IActionFilter
{
    public async Task<HttpResponseMessage>  ExecuteActionFilterAsync(
        HttpActionContext actionContext,
        CancellationToken cancellationToken,
        Func<Task<HttpResponseMessage>> continuation)
    {
        var result = continuation();
        await Task.Delay(15 * 1000); // induce a delay of 15 seconds
        result.Wait();
        return await result;
    }
To take it a step further, you can also emit System.Diagnostics.Trace.WriteLine calls within your application code and they will also surface in FREB as events thus allowing you to debug the application code even better.
Hope this helps in troubleshooting performance issues within your app!
Happy Debugging!
Leave a comment