
Collect Network Trace Via Autohealing on Azure App Service
Auto-healing feature of Azure App service allows you to take custom actions that collect diagnostic data like memory dumps, CLR profilers that help in identifying performance or application exception issues easily. At times, applications may misbehave due to some networking related problems and in these situations, a network trace collected at the time of the issue may help in diagnosing the problem.
Note: It is possible to collect Network Trace manually by going to Diagnose and Solve Problems -> Diagnostic Tools -> Collect Network trace but the option of configuring Network Trace as a diagnostic tool via Auto-healing does not exist and this blog tries to address that specific scenario.
Why is it not possible to configure Network Trace via Auto-healing?
Most of the Diagnostic tools (like Memory Dump, .NET Profiler) exist as executables that can run directly on the instance serving the app. Once invoked via the Portal, these tools run within the Azure App Service Sandbox and they can collect the required data. Collecting Network traces on a machine requires Administrator level privileges, hence it is not possible to invoke it directly. The way Network Traces are invoked today are by calling a management API that requires Azure Resource Manager level access.
How to Invoke a Network Trace Via Auto-healing
This blog covers all the steps required to invoke a Network Trace via Auto-Healing. Here is a summary of what all needs to be done
- A new Azure Active Directory App needs to be created.
- This new Azure Active Directory app needs Owner level permissions on the Azure Web App where the network trace needs to be collected.
- The CollectNetworkTrace.exe needs to be copied to your app content folder and the AppId, Secret and the TenantId of the Azure Active Directory App (created in Step 1) needs to be passed to this EXE.
- The CollectNetworkTrace.exe then needs to be configured under the Auto-healing configuration as a Custom Action.
Once you are done, you can delete the Azure Active Directory App that you created in Step 1.
Step 1 – Create a New Azure Active Directory App
- Go to Azure Portal, https://portal.azure.com
- Choose Azure Active Directory and click on App Registrations and click on New Registration
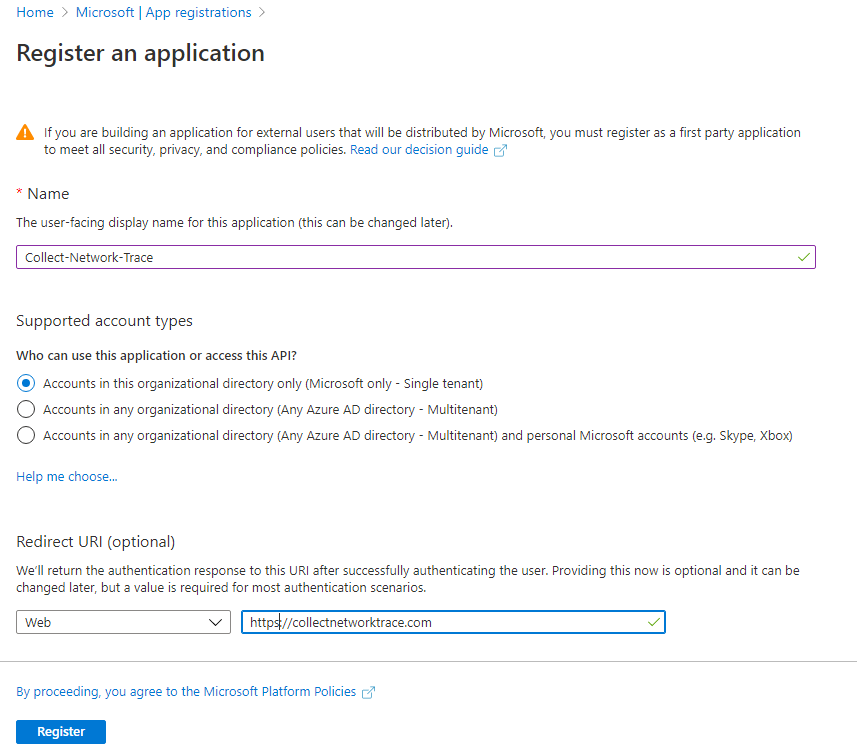
- Register an Application in this way.
- Give a friendly name (e.g. Collect-Network-Trace)
- Choose Accounts in this organization directory only
- Choose the Redirects URI as Web and the Redirect URI can be anything but it needs to start with https and it has to point to a non-existing site or domain. In this case I used https://collectnetworktrace.com as an example.
- After registering the app, go to the Overview tab for the newly created App Registration and take a note of Application (client) ID and Directory (tenant) ID.
- Post this, go to Certificates and Secrets and generate a New Client Secret.
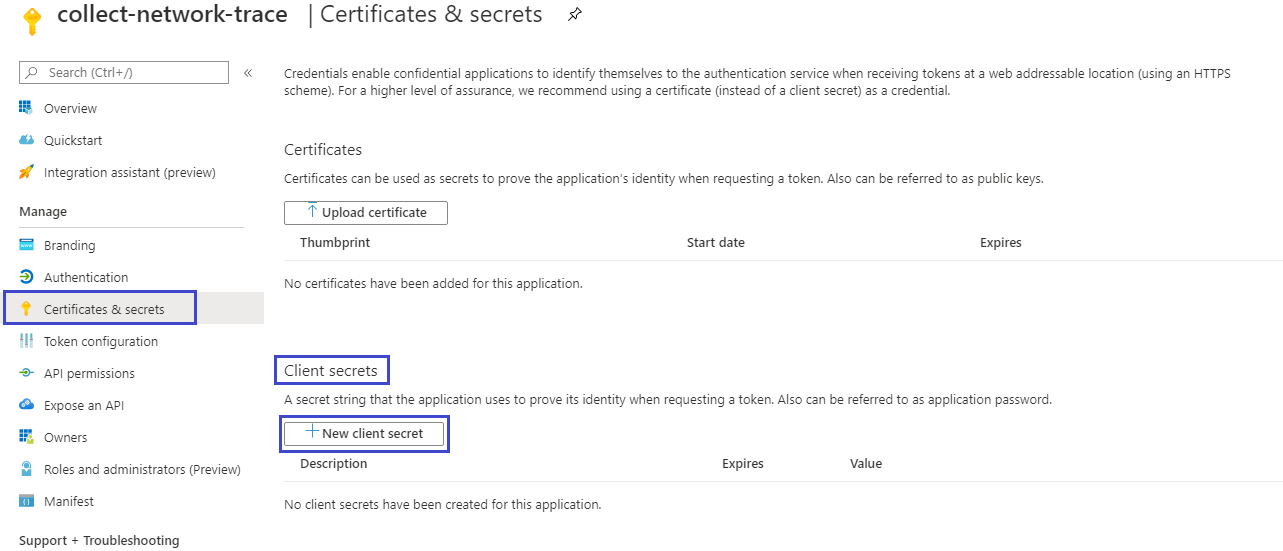
- Give a friendly Description and choose the Expiry of the secret as per your choice. Keep a note of this Client Secret.
By this time, we have successfully created an Active Directory App Registration.
Step 2 – Give permissions to the Azure Active Directory App to access the App Service
Now it’s time to configure the access for the newly created Azure Active Directory App Registration to the Azure App Service on which you want to collect the Network trace.
-
From the Azure Portal (https://portal.azure.com), open the Web App on which you want to collect the network trace via Auto-healing.
-
Click on Access Control (IAM) and click on Add button to add a new Role Assignment
-
Choose Collect-Network-Trace app (that we created in Step 1), give it Owner permissions on your Web App and save the Role Assignment
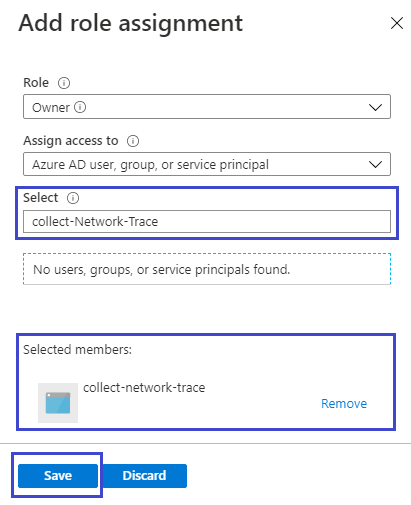
At this point, the Collect-Network-Trace active directory app has ARM permissions to the web app on which network trace need to be collected.
Step 3- Copy and Configure the CollectNetworkTrace.exe to your App Service
- Download the CollectNetworkTrace.exe.
- Open the KUDU console for your Web App (Kudu Console’s URL is https://<yourappname>.scm.azurewebsites.net.
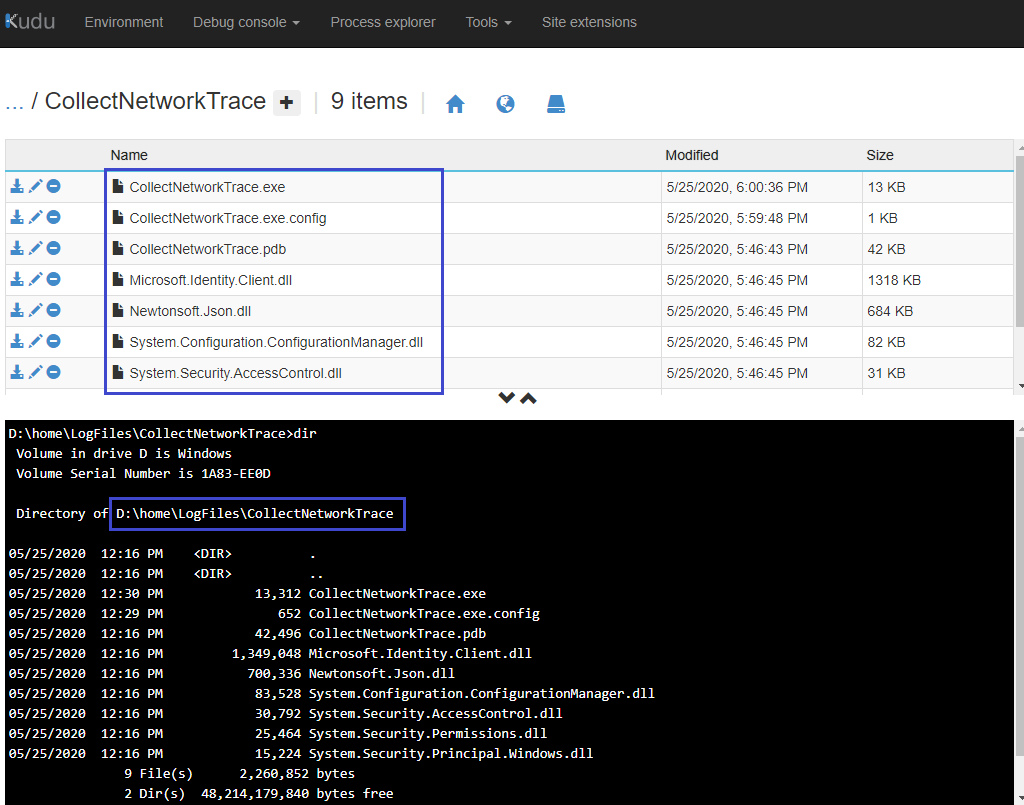
- Go to the Debug Console under Kudu and create a new folder CollectNetworkTrace under D:\home\LogFiles
- Paste the contents of the CollectNetworkTrace.zip inside this new folder. This is how the folder should look like after you have extracted all the files.
-
At this point you have two options of providing the Active Directory App’s secrets to the CollectNetworkTrace.exe.
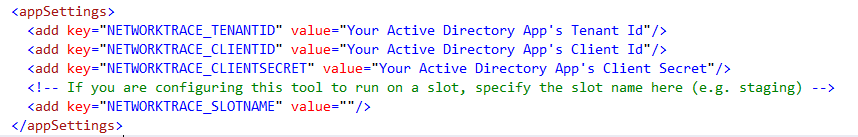
a. You can either, configure the secrets as Application Settings under Configuration - 3 APP Settings need to be configured for your app. They are: -
- NETWORKTRACE_TENANTID
- NETWORKTRACE_CLIENTID
- NETWORKTRACE_CLIENTSECRET
IMPORTANT: If you are configuring this tool to run on a slot, specify the slot name here (e.g. staging) in setting NETWORKTRACE_SLOTNAME Update the App Settings with the correct values of the Active directory App that you created in Step 1. Make sure you Save the settings after adding them
b. Or you can configure the secrets in the NetworkTrace.exe.config present inside d:\home\logfiles\NetworkTrace folder. These are the values that need to be specified.
IMPORTANT NOTE: By default, this tool captures, the trace of the production slot of the app. If you want this tool to capture traces from one of the app’s slots, you need to modify NETWORKTRACE_SLOTNAME setting either in CollectNetworkTrace.exe.config or in APP SETTINGS.
After configuring the secrets, just run “CollectNetworkTrace.exe 60” once from KUDU console. If everything goes fine, you should see an output like this, and a network trace file should be collected inside the location specified in the message.
D:\home\LogFiles\CollectNetworkTrace>CollectNetworkTrace.exe 60
5/25/2020 1:14:01 PM Token acquired
5/25/2020 1:14:01 PM Chosen duration for Network Trace = 60
5/25/2020 1:14:01 PM Invoking https://management.azure.com/subscriptions/SubId/resourceGroups/RG/providers/Microsoft.Web/sites/SiteName/networkTrace/start?durationInSeconds=60&api-version=2015-08-01
5/25/2020 1:14:01 PM Sleeping for 60 seconds
5/25/2020 1:15:04 PM Trace File captured at D:\home\LogFiles\networktrace\10.0.1.46_2020_05_25T13_14_01.zip hence exiting...
Note: - The CollectNetworkTrace.exe tool’s source code is @ https://github.com/puneet-gupta/CollectNetworkTrace. Feel free to review the code or alter it per your requirements
Step 4- Configure the CollectNetworkTrace.exe to be invoked via Auto-healing
Now the last step remaining is to configure the CollectNetworkTrace.exe in Auto-Healing configuration as a Custom Action. To do that
- Open Diagnose and Solve Problems for your App by going to https://portal.azure.com
- Go to Diagnostic Tools and choose Auto-Heal.
- Defined Conditions as per your scenario.
- Choose the action as Custom Action and switch to Run Any Executable tab and specify d:\home\logfiles\CollectNetworkTrace\CollectNetworkTrace.exe as the executable to be launched.
- In Additional Parameters specify the duration (in seconds) for the network trace collection. Do NOT set this value above 900 as the tool will default to 60 seconds.
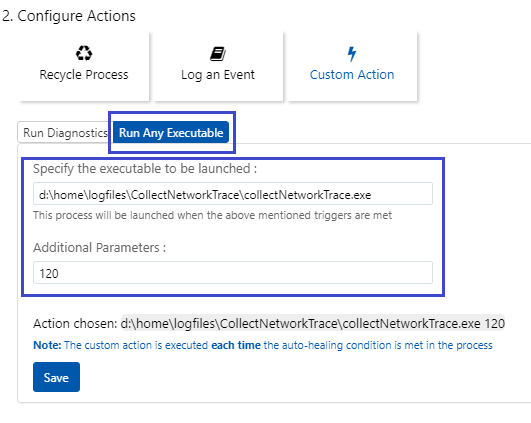
- Hit the Save button and click Save on the Auto-healing main section to save the settings.
That’s it. You are all set now. Whenever the specified conditions are met, the Auto-Healing feature of Azure App Service will collect the network trace and you’ll be able to download the Network Trace from the Kudu Console for your app.
Hope this article helps in identifying intermittent network issues in your app. Feel free to share your feedback or questions about App Service Diagnostics by emailing diagnostics@microsoft.com or posting on UserVoice with “[Diag]” in the title.
Leave a comment