EventId 4196 - Troubleshooting Crashes in COM+ Applications
Typically we expect that a piece of code that works once should work ALWAYS but this is not as simple as it sounds. Even though you have tested your component or application enough, it is not always possible to test all the codepaths and all sorts of situations that can arise in an application. As a result of this you may end up seeing intermittent or unexpected crashes in your application. Today we will learn about collecting some valuable information for unexpected crashes that can happen in COM+ components and how to deal with them.
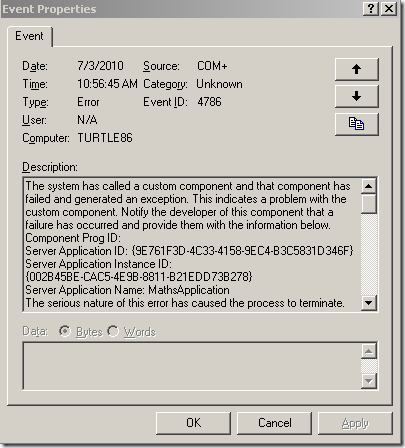
What is a Crash? – The term CRASH is used by different people in various different ways. In our(or my) definition a crash is an unexpected termination of a process as result of an unhandled exception in the code. If COM+ encounters an unhandled exception in the component code the COM+ Runtime terminates the process immediately and logs the following event in the event viewer letting the user know that a crash has happened. This is called COM+ Failfast
This particular behavior of COM+ terminating the process on an unexpected error condition is termed as COM+ Failfast.
This blog will list out the steps required to troubleshoot a COM+ Failfast and it can be summarized as:-
- Generating the Symbols for the application
- Configuring the debugger to collect dumps on the right exception
- Collecting the dump file
- Analyzing the dump using a windows debugger.
- Making relevant code changes to correct the problem.
Now we will look at each of the above steps in detail
To walk you through the process, I wrote a COM component in VB 6.0 and configured it in COM+. I intentionally have some bad code in my component which is causing the component to Crash. I am calling the component from a very simple VBSCRIPT file like this.
Dim MathComponentSet MathComponent = Createobject("Arithmetic.Maths")wscript.echo = MathComponent.DoSomeCalculation(1,2,3)
On running the above script file, I can see a crash in the DLLHOST process and the following event is logged in the event viewer.
Event Type: Error
Event Source: COM+
Event Category: Unknown
Event ID: 4786
Date: 7/3/2010
Time: 10:56:45 AM
User: N/A
Computer: TURTLE86
Description:
The system has called a custom component and that component has failed and generated an exception. This indicates a problem with the custom component. Notify the developer of this component that a failure has occurred and provide them with the information below.
Component Prog ID:
Server Application ID: {9E761F3D-4C33-4158-9EC4-B3C5831D346F}
Server Application Instance ID:
{002B45BE-CAC5-4E9B-8811-B21EDD73B278}
Server Application Name: MathsApplication
The serious nature of this error has caused the process to terminate.
Exception: C0000008
Address: 0x7C8285F3
Call Stack:
ntdll!KiRaiseUserExceptionDispatcher + 0x37
ntdll!KiFastSystemCallRet + 0x0
Arithmetic!DllCanUnloadNow + 0x272
Arithmetic!DllCanUnloadNow + 0x1c4
Arithmetic!DllCanUnloadNow + 0x117
Arithmetic!DllCanUnloadNow + 0x6a
OLEAUT32!DispCallFunc + 0xab
MSVBVM60!__vbaAptOffset + 0x68b
MSVBVM60!BASIC_CLASS_Invoke + 0x65
OLEAUT32!DispGetParam + 0x718
OLEAUT32!DllRegisterServer + 0x5bf
RPCRT4!NdrAsyncServerCall + 0x1e7
RPCRT4!CStdStubBuffer_Invoke + 0x82
OLEAUT32!DispGetParam + 0x5b6
ole32!StgGetIFillLockBytesOnFile + 0x13d32
ole32!StgGetIFillLockBytesOnFile + 0x13cdf
ole32!DcomChannelSetHResult + 0xaab
ole32!DcomChannelSetHResult + 0x495
ole32!CoFreeUnusedLibrariesEx + 0xb06
ole32!StgGetIFillLockBytesOnFile + 0x13bec
ole32!StgGetIFillLockBytesOnFile + 0x13a7d
ole32!StgGetIFillLockBytesOnFile + 0x12f64
ole32!CoFreeUnusedLibrariesEx + 0x9f5
ole32!CoFreeUnusedLibrariesEx + 0x9c0
USER32!LoadCursorW + 0x4cf5
USER32!LoadCursorW + 0x4e86
USER32!TranslateMessageEx + 0x10d
USER32!DispatchMessageW + 0xf
COMSVCS!DllUnregisterServer + 0x270
COMSVCS!DllUnregisterServer + 0x180
COMSVCS!DllUnregisterServer + 0xc6c
COMSVCS!DllUnregisterServer + 0xf4d
msvcrt!_endthreadex + 0xa3
kernel32!GetModuleHandleA + 0xdf
The above event entry also contains the callstack information for the thread on which the unhandled exception is thrown but there is just a small problem with the callstack that is shown in the Event. The callstack may or may not show you the right function names because of missing symbols. For e.g. the stack is showing me that functions from my DLL Arithmetic.dll (highlighted in blue) were called but it just showing one function name DllCanUnloadNow where as in my VB code I never wrote a function called DllCanUnloadNow(). So what is the DllCanUnloadNow function. Well that is what the debugger is able to match the closest based on the default export function table of a DLL and it needs symbols to translate the memory offsets to function names. Now what exactly is a symbol ???
It is very critical for us to know the exact function where the problem happened (and if possible the exact line of code) and we can find that information only if we have the right symbols for our DLLs. Symbols (or pdb files) are binary files that are generated by compilers during code generation which help you translate the function offsets in a module to the RIGHT function names. More information on symbols and their importance can be found on
this link and thousands of other articles and blogs available on the internet.
In older versions of Visual Studio (as old as Visual Studio 6.0), symbols were NOT generated for DLL’s \EXE’s by default. I just want to provide the steps needed to generate the PDB files for VB 6.0 and VC 6.0 applications.
To generate the symbols for DLL’s written in Visual Basic 6.0
- Open the Visual Basic Project in Visual Studio 6.0.
- From the Project menu option select the <project name> Properties… option.
- Go to the third tab (Compile) and check the Checkbox for Create Symbolic Debug Info
- After selecting this, Recompile the project. This time you would see a file with a .PDB extension generated with the same name as the name of the DLL and in the same folder where the DLL is generated.
To generate the symbols for a VC++ DLL
- Open the Project in Visual Studio.
- Go to project properties.
- Under the Linker Section, select the Debugging Sub Section and select YES for Generate Debug Info.
- Rebuild the project.
After generating the symbols for your component, it is very important that you redeploy the newer DLL that got generated to the server because for a debugger to align the symbols properly the timestamp of the PDB and the timestamp of the DLL has to match.
The next thing to do after deploying symbols is to use a Windows native debugger to capture a dump on the exception of interest and debug it using the symbols that we generated. There are some native debuggers available for this purpose (like WINDBG, CDB, NTSD etc.) but I will talk about the Debug Diagnostic Tool which is easy to use and understand. You can get the Debug Diagnostic tool from Microsoft download center and install it on the server where you are seeing the crash.
Debug Diagnostic tool lets you generate as well analyze the dumps. This tool provides you a friendly GUI that can be configured to take dumps of any process. You can follow these steps to configure dumps for the COM+ Application which is crashing.
- Launch the tool by going to Start- > Programs -> Debug Diagnostic Tool 1.1 ->DebugDiag 1.1
- In the Select Rule Type action, select Crash and click Next
- In the Select Target Type section, select A specific MTS/COM+ Application.
- From the list select the COM+ Application which is experiencing the Crash.
- In the Advanced Confirmation section, click on Breakpoints and then click Add Breakpoint
- Select ComSvcs!ComSvcsExceptionFilter (I will talk about this shortly) and change the Action Type to Full User Dump. You can change the Action Limit to 5 which configures the tool to take 5 dumps and then complete the rule.
- Click Ok and click Save and Close
- Click Next and in the Select Dump Location and Rule Name dialog, you can configure a friendly rule name and specify a location on the hard drive where the dump will be generated.
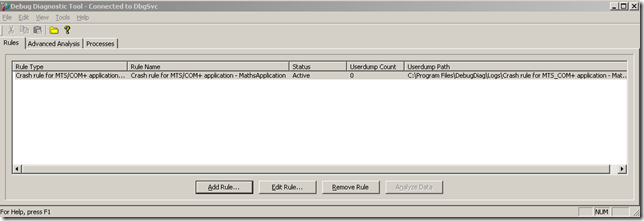
- Click Next and Finish to Activate the rule. Once the wizard completes the rule should come in the Rules section with a status of Active and should look like this.
For COM+ Applications, it is better to configure the ComSvcs!ComSvcsExceptionFilter breakpoint because that function implements the COM+ Failfast logic. Configuring the breakpoint on this function ensures that we are getting the dumps at the right time.
At this point you just have to wait for the crash to happen again. If this is an easily reproducible issue, you may just go ahead and reproduce it once so that the debugger is able to take the dumps. Whenever the dumps are collected by this tool, you will notice the UserDump Count variable incremented by 1.
There may be multiple dumps generated by the tool based on what you configured it for but the one you are most interested to look at is the one which contains ComSvcsExceptionFilter in the name. The dump file that got generated on my machine as a result of this tool had the name
dllhost__PID__6492__Date__07_03_2010__Time_11_56_44AM__725__ComSvcs!ComSvcsExceptionFilter.dmp
Now starts the fun part :-). As I mentioned before, you can use any native Windows Debugger to analyze the dump file but to keep things simple again, we can use the built in analyzer of Debug Diagnostic tool to view the relevant information about the dump file. To analyze the dump using DebugDiag, you just double click on the .dmp file that you generated in the previous step which will launch the DebugDiag analyzer automatically or you can follow these steps.
- Open Debug Diagnostic tool.
- Go to Advanced Analysis tab
- Click on Add Data Files
- Browse to the dump file generated in the previous step and click on Start Analysis.
The moment you click on Start Analysis, the Debug Diagnostic tool will start downloading symbol files from the Microsoft Symbol server for the relevant DLLs and after running some expert analysis on the dumps, it will launch an Internet Explorer window with the HTML report of the analysis. So running the analysis on my dump file showed me this in the DebugDiag report.
|
If you click on proper thread number in the above report, you can actually see the callstack of the thread which caused the exception and notice how nicely the report is showing you the recovered callstack for the exactly exception. In my case, I see the following callstack
|
So all that is fine but why am I seeing DllCanUnloadNow and not the right function name?
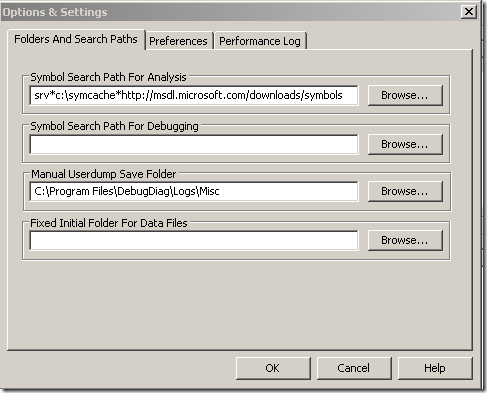
The reason for that is that we have not configured Debug Diagnostic to load the right symbols for my DLL. This configuration in Debug Diagnostic tool is done under the Tools menu by selecting Options and Settings. These are the default settings.
All you need to do is append the path to the folder where the PDB files for your component are to “Symbol Search Path for analysis”. So in my case, the PDB files are present inside E:\COMProjects\ArithmeticComponent folder, so my Symbol Search Path for analysis will become
srv*c:\symcache*http://msdl.microsoft.com/downloads/symbols;E:\COMProjects\ArithmeticComponent
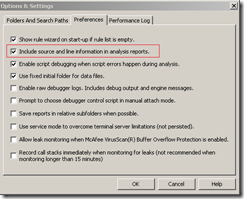
Now if I run Debug Diagnostic tool again on the same report, I can see the functions reported in a better way but before doing that I would like to turn on one more setting under the Preferences tab under Options and Setting and that is selecting “Include source and line information in analysis reports”
After making these changes I re-run my report and now if I look at the Recovered Callstack for Thread 13, I can see the right function names
|
If you read carefully, I am even getting the line numbers in my Visual Basic .CLS file which tell me the exact line of code where the problem happened. Now isn't that cool !!!
Here is the complete code of my sample component
Private Declare Function CloseHandle Lib "kernel32" (ByVal hObject As Long) As Long
Public Function DoSomeCalculation(ByVal number1 As Integer, ByVal number2 As Integer, ByVal number3 As Integer) As Integer
DoSomeCalculation = CallFirstFunction(number1, number2, number3)
End Function
Function CallFirstFunction(ByVal number1 As Integer, ByVal number2 As Integer, ByVal number3 As Integer) As Integer
CallFirstFunction = CallSecondFunction(number1, number2, number3)
End Function
Function CallSecondFunction(ByVal number1 As Integer, ByVal number2 As Integer, ByVal number3 As Integer) As Integer
CallSecondFunction = CallThirdFunction(number1, number2, number3)
End Function
Function CallThirdFunction(ByVal number1 As Integer, ByVal number2 As Integer, ByVal number3 As Integer) As Integer
Dim sum As Integer
Dim returnValue As Long
returnValue = CloseHandle(number1 + number2 + number3)
CallThirdFunction = returnValue
End Function
So you can see that I am just passing a bad value (1 + 2 + 3 = 7) to the Kernel32's CloseHandle API which ends up throwing the "Invalid Handle" exception.
The same steps can be used for troubleshooting crashes in COM+ Applications written in any programming language provided you generate the right symbols and you configure the debugger to point to the right symbols.
I am attaching the complete report to the end of this blog post so that you can review what else is logged in the report.
HAPPY DEBUGGING !!!


Leave a comment